Data Table
Since the study is conducted in global scale, all the datasets utilized for analysis are obtained from the World Bank, which is a reliable source of the acquisition of international database. See table 1-4 for the abbreviated table of four datasets that are utilized in statistical analysis, only certain years and countries are selected for display.
All the datasets that are analyzed in the study are formatted relatively uniformly. Country and year are both considered as independent variables, where country is categorical variable and year is continuous variable. Emissions and GDP are considered as dependent variables. However, since the main objective for this study is to identify the outliers in the datasets and there is no analysis of the relationship between variables is involved in this particular study, the identification of dependent and independent variables is irrelevant.

Table 1: Abbreviated table of total CO2 Emissions (kt) of each country from 1960 to 2016.

Table 2: Abbreviated table of total population of each country from 1960 to 2016.

Table 3: Abbreviated table of GDP per capita (US$) of each country from 1960 to 2016

Table 4: The abbreviated table of Nitrous oxide emissions (thousand metric tons of CO2 equivalent). Nitrous oxide emissions are emissions from agricultural biomass burning, industrial activities, and livestock management. The data from 1970-1977 is selected for display due to the absence of data of previous years.
Expletory Graphics
Three line graphs are generated based on the raw data, which are Nitrous oxide (N2O) emission per capita, CO2 emissions per capita, and GDP per capita for each country within the same time period from 2001 to 2012. the line plot shows the trend of each parameters and compares the general trends between countries.
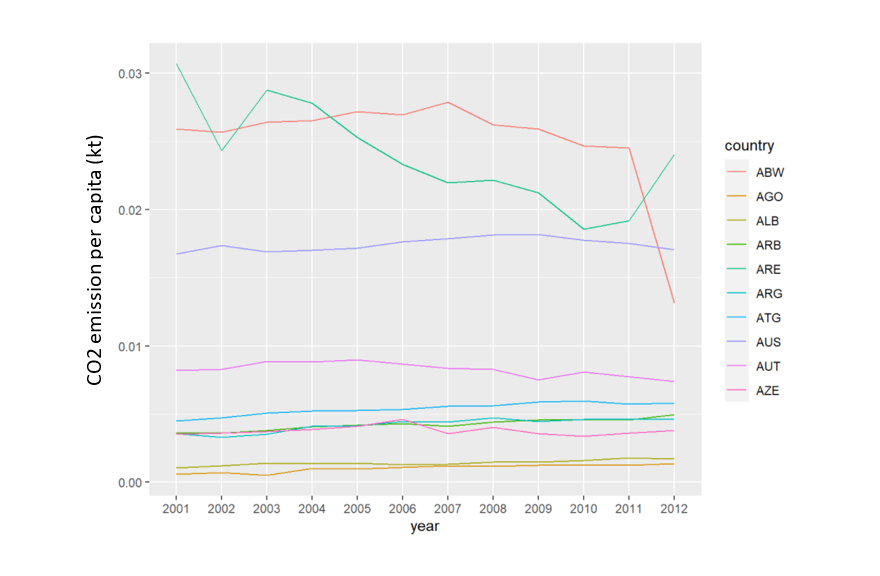
Fig. 3: CO2 emissions (kt) per capita of countries from 2001 - 2012. ( only 10 countries are added for display due to the limited space, abbreviations are country codes)

Fig 4: Nitrous oxide emissions (thousand metric tons of CO2 equivalent) per capita of countries from 2001 - 2012. ( only 10 countries are added for display due to the limited space, abbreviations are country codes)

Fig. 5: GDP per capita (current US$) of countries from 2001 - 2012.
